9. Analytics and Statistics
Where: sidebar → Performance → Statistics
(/courseware/course/{courseId}/performance/statistics)
Performance lists four items in this order: Grades, Labs Performance, Leaderboard, Statistics. Labs Performance is not built yet — it shows “Lab Performance coming soon”.
9.1 Course Statistics
Five expandable panels:
Course Contents Statistics
A sunburst chart of your course structure and how much of it students have reached. Useful for spotting chapters nobody has opened.
Student Active Time Statistics
When your students are actually working. Worth checking before you schedule a deadline; if your class works late at night, a 9 a.m. cut-off costs you submissions.
Download CSV exports the underlying access log.
Multimedia Book Access Statistics
Access broken down by chapter and by section. This shows reach: who opened what.
Download Stats CSV gives you a zip containing a student-wise and a video-wise CSV.
Video Statistics
Summary cards (total videos, average completion, students enrolled) above a per-video table: video name, chapter, section, duration, students watched, and average percent completed. Expand a row for the per-student breakdown — watch time, watched till, and percent completed. There is a search box and, under Actions, a Download CSV export.
This panel is behind a build-time flag, so its availability differs between deployments; it is on in the standard production build and off in development. If you do not see it, your installation has it switched off.
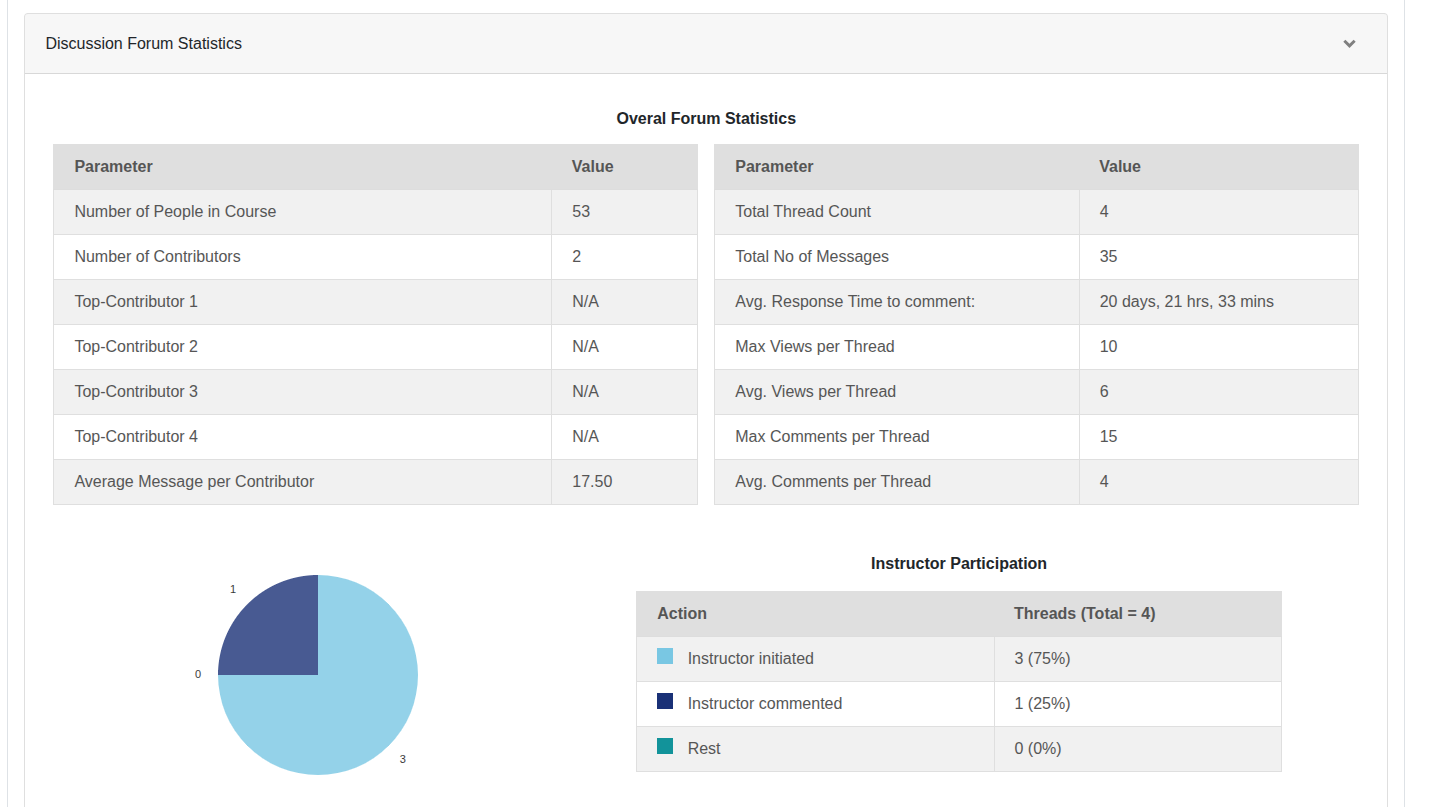
Discussion Forum Statistics
Overall forum activity, participation per student, and an activity timeline. The participation view is the practical one; it identifies students who have never posted.
9.2 Quiz Report
Under Reports on the same page, and the only report there. Per-quiz performance
across the class, with filters for student, quiz, group, concept, quiz type and
attempt status, a per-question details modal, and an Export to Excel button (this
one is .xlsx, not CSV).
This is the working quiz report. The View Statistics button on an individual quiz shows “Statistics Coming Soon”. That panel was never built. Come here instead.
9.3 Leaderboards
Course leaderboard
Performance → Leaderboard
The maximum out-video and in-video scores are shown for the course as a whole. Each student then gets a row of in-video score and attempts (I-S, I-A), out-video score and attempts (O-S, O-A), and the totals (T-S, T-A). Expand a row to see that student’s per-item maxima.
Filter Score based on Chapter/Section lets you build a leaderboard for part of the course; ticking a chapter selects all its sections.
Two actions:
Download Scorecard: CSV export. It exports what is currently on screen, so a chapter/section filter applies to the file too.
e-mail: a composer with Subject, a comma-separated Cc list, and a markdown editor. It only opens for an approved instructor on the course.
This page is restricted to instructors and STAs of this course; other roles are sent to the student view of the leaderboard instead.
Students control their own visibility — but only to each other. Each student has a Show Marks To Public / Hide Marks from Public toggle, on by default. It hides them from the leaderboard their classmates see. Your instructor leaderboard is unaffected and always lists every active student.
Lab leaderboard
Reachable from a lab’s Actions ▾ → Leaderboard. Shows total students, highest, average, and lowest score, with one column per activity, and refreshes every 15 seconds, which makes it usable as a live display during a lab session.
⚠️ It counts programming activities only. Lab quizzes in the same lab contribute nothing to these totals.
9.4 Video watch statistics
Available through the Video Statistics panel where enabled.
Two figures are reported side by side and mean different things:
% Completed is built from the intervals a student actually watched, merged so that rewatching does not count twice. Skipping forward does not credit the skipped part.
Watched Till is simply the furthest point reached, so it can be far ahead of the percentage.
⚠️ Treat the percentages as indicative, not exact. A video whose duration is not yet recorded reports 0% for everyone until someone plays it, and a student who has watched from more than one browser session can end up with duplicate tracking rows. Use the figures to spot who has not engaged at all, not to grade engagement precisely.
9.5 Exporting data
Data |
Where |
|---|---|
Grades |
Grades → Export CSV (§7.9) |
Student list |
People → Actions → Export All/Active/Inactive Students |
TA list |
People → Current TAs → Export TAs as CSV |
Proctor log |
Live Dashboard → Download as CSV (§6.7) |
Submissions |
Activity submissions → More → Download as CSV (marks) / Download All Submissions (zip of the code) |
Leaderboard |
Download Scorecard |
Video completion |
Statistics → Video Statistics → Actions → Download CSV |
Multimedia access |
Statistics → Multimedia Book Access Statistics → Download Stats CSV |
Access log |
Statistics → Student Active Time Statistics → Download CSV |
Quiz report |
Reports → Quiz Report → Export to Excel |
Previous: 8. Announcements, Email and the Forum · Next: 10. Reference